BI SQL Editor


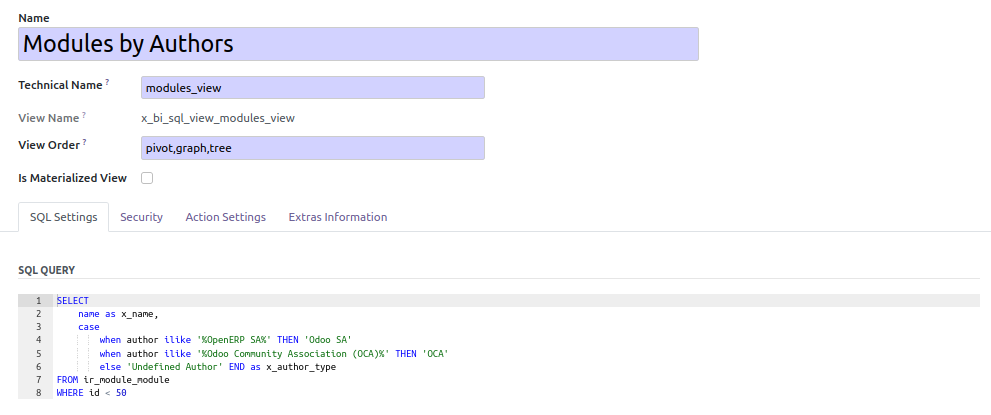
This module extends the functionality of reporting, to support creation
of extra custom reports. It allows user to write a custom SQL request.
(Generally, admin users)
Once written, a new model is generated, and user can map the selected
field with odoo fields. Then user ends the process, creating new menu,
action and graph view.
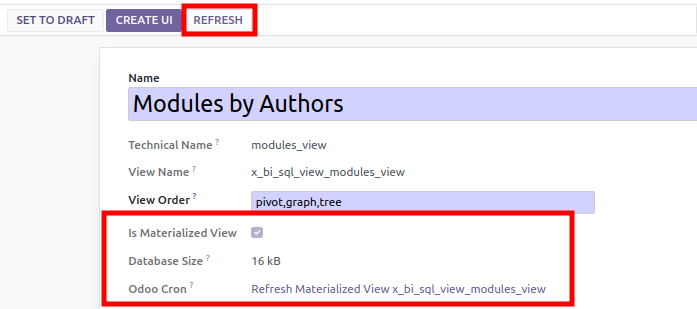
Technically, the module create SQL View (or materialized view, if option
is checked). Materialized view duplicates datas, but request are
fastest. If materialized view is enabled, this module will create a cron
task to refresh the data).
By default, users member of ‘SQL Request / User’ can see all the views.
You can specify extra groups that have the right to access to a specific
view.
Warning
This module is intended for technician people in a company and for Odoo
integrators.
It requires the user to know SQL syntax and Odoo models.
If you don’t have such skills, do not try to use this module specially
on a production environment.
Use Cases
this module is interesting for the following use cases
- You want to realize technical SQL requests, that Odoo framework
doesn’t allow (For exemple, UNION with many SELECT) A typical use
case is if you want to have Sale Orders and PoS Orders datas in a
same table
- You want to customize an Odoo report, removing some useless fields
and adding some custom ones. In that case, you can simply select the
fields of the original report (sale.report model for exemple), and
add your custom fields
- You have a lot of data, and classical SQL Views have very bad
performance. In that case, MATERIALIZED VIEW will be a good solution
to reduce display duration
Table of contents
Optionnaly, you can add a domain.
A tipical domain in a multi company context is to write
['|', ('company_id', '=', False), ('company_id', 'in', company_ids)]
to make reporting depending on the current companies of the user.
Click on the button ‘Validate SQL Expression’
Once the sql request checked, the module analyses the column of the
view, and propose field mapping. For each field, you can decide to
create an index and set if it will be displayed on the pivot graph as
a column, a row or a measure.

Click on the button ‘Create SQL elements’. (this step could take a
while, if view is materialized)
If it’s a MATERIALIZED view:
- a cron task is created to refresh the view. You can so define
the frequency of the refresh.
- the size of view (and the indexes is displayed)

Before applying the final step, you will need to add a specific
Parent Menu to use when creating the UI Menu for the report. By
default, it will be set with the SQL Views menu, which can be
changed before creating the UI elements in order to have the report
accessible from a different place within Odoo.
Finally, click on ‘Create UI’, to create new menu, action, graph view
and search view.
To use this module, you need to:
- Go to ‘Dashboards > SQL Reports’
- Select the desired report

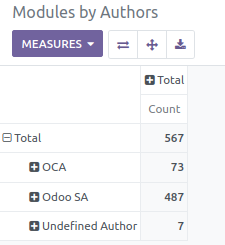
- You can switch to ‘Graph’ or ‘tree’ views as any report.
Bugs are tracked on GitHub Issues.
In case of trouble, please check there if your issue has already been reported.
If you spotted it first, help us to smash it by providing a detailed and welcomed
feedback.
Do not contact contributors directly about support or help with technical issues.
Maintainers
This module is maintained by the OCA.

OCA, or the Odoo Community Association, is a nonprofit organization whose
mission is to support the collaborative development of Odoo features and
promote its widespread use.
Current maintainer:

This module is part of the OCA/reporting-engine project on GitHub.
You are welcome to contribute. To learn how please visit https://odoo-community.org/page/Contribute.


